In this article, you can gain insight into Happeo's Advanced Analytics and learn what each element consists of.
Package information: Happeo’s Analytics are available for Growth and Enterprise Packages.
Permissions: Advanced Analytics can be viewed by platform admins and users with analytics permissions. Learn more about analytics permission in this article.
Happeo’s Advanced Analytics, which is accessible by Admins, provides you with insight into what’s been happening inside your Happeo.
For example, you can find data and graphs showing you how users interact with Channels and Pages in your environment. You can also find influencer statistics and search data.
Data updates
Happeo’s Advanced Analytics can be found by clicking on your avatar and selecting Analytics.
Note: If you are on the Starter Package, you will only see Activity and Influence metrics.
Controls
Note: Applying a control (filter, date range, or interval) focuses on user activity within the specified parameters. It's important to understand that a CSV export includes all posts that generated impressions during this timeframe, regardless of their creation date. In essence, controls refine how you analyze user interaction with posts, not the posts themselves.
At the top of the Analytics page (by default you will be taken into the Analytics Overview), you can find filters, namely:
-
Date range
- Last 7 days
- Last 30 days
- Last quarter
- Last year
-
Custom
- Choosing this option will display data for the "last tracking period." This refers to the time range preceding the current selection. For instance, if you set the custom date range to June 13 to July 24, the last tracking period would encompass the 7 days leading up to June 13. The last tracking period is the same amount of time as the custom date range you have set (e.g. 7 days before the last 7 days)
-
Interval
- Daily
- Weekly
- Monthly
You can easily toggle between different date ranges or select a custom date range. This will change the data calculated in the overview.
Note: The data range and interval options will remain visible at the top as you navigate through different sections, such as Channel Overview, Pages Overview, etc.
You can also export a CSV, which will give you the possibility to dig deeper into the data and make your own graphs such as with Google Sheets.
By clicking on the Filters tab on the left of the page, you can also filter the data based on Organization unit paths and Organizations.
Note: For Microsoft organizations, the option to filter based on Organization unit paths is not available unless the Microsoft organization has set up trust with a Google organization.
Lastly, whenever you are presented with a graph, you can change the presentation of the data by clicking on the graph symbol at the top right corner of the graph.
Additionally, sometimes filtering options will be available at the bottom of a graph that you can toggle between or have toggled simultaneously.
Overview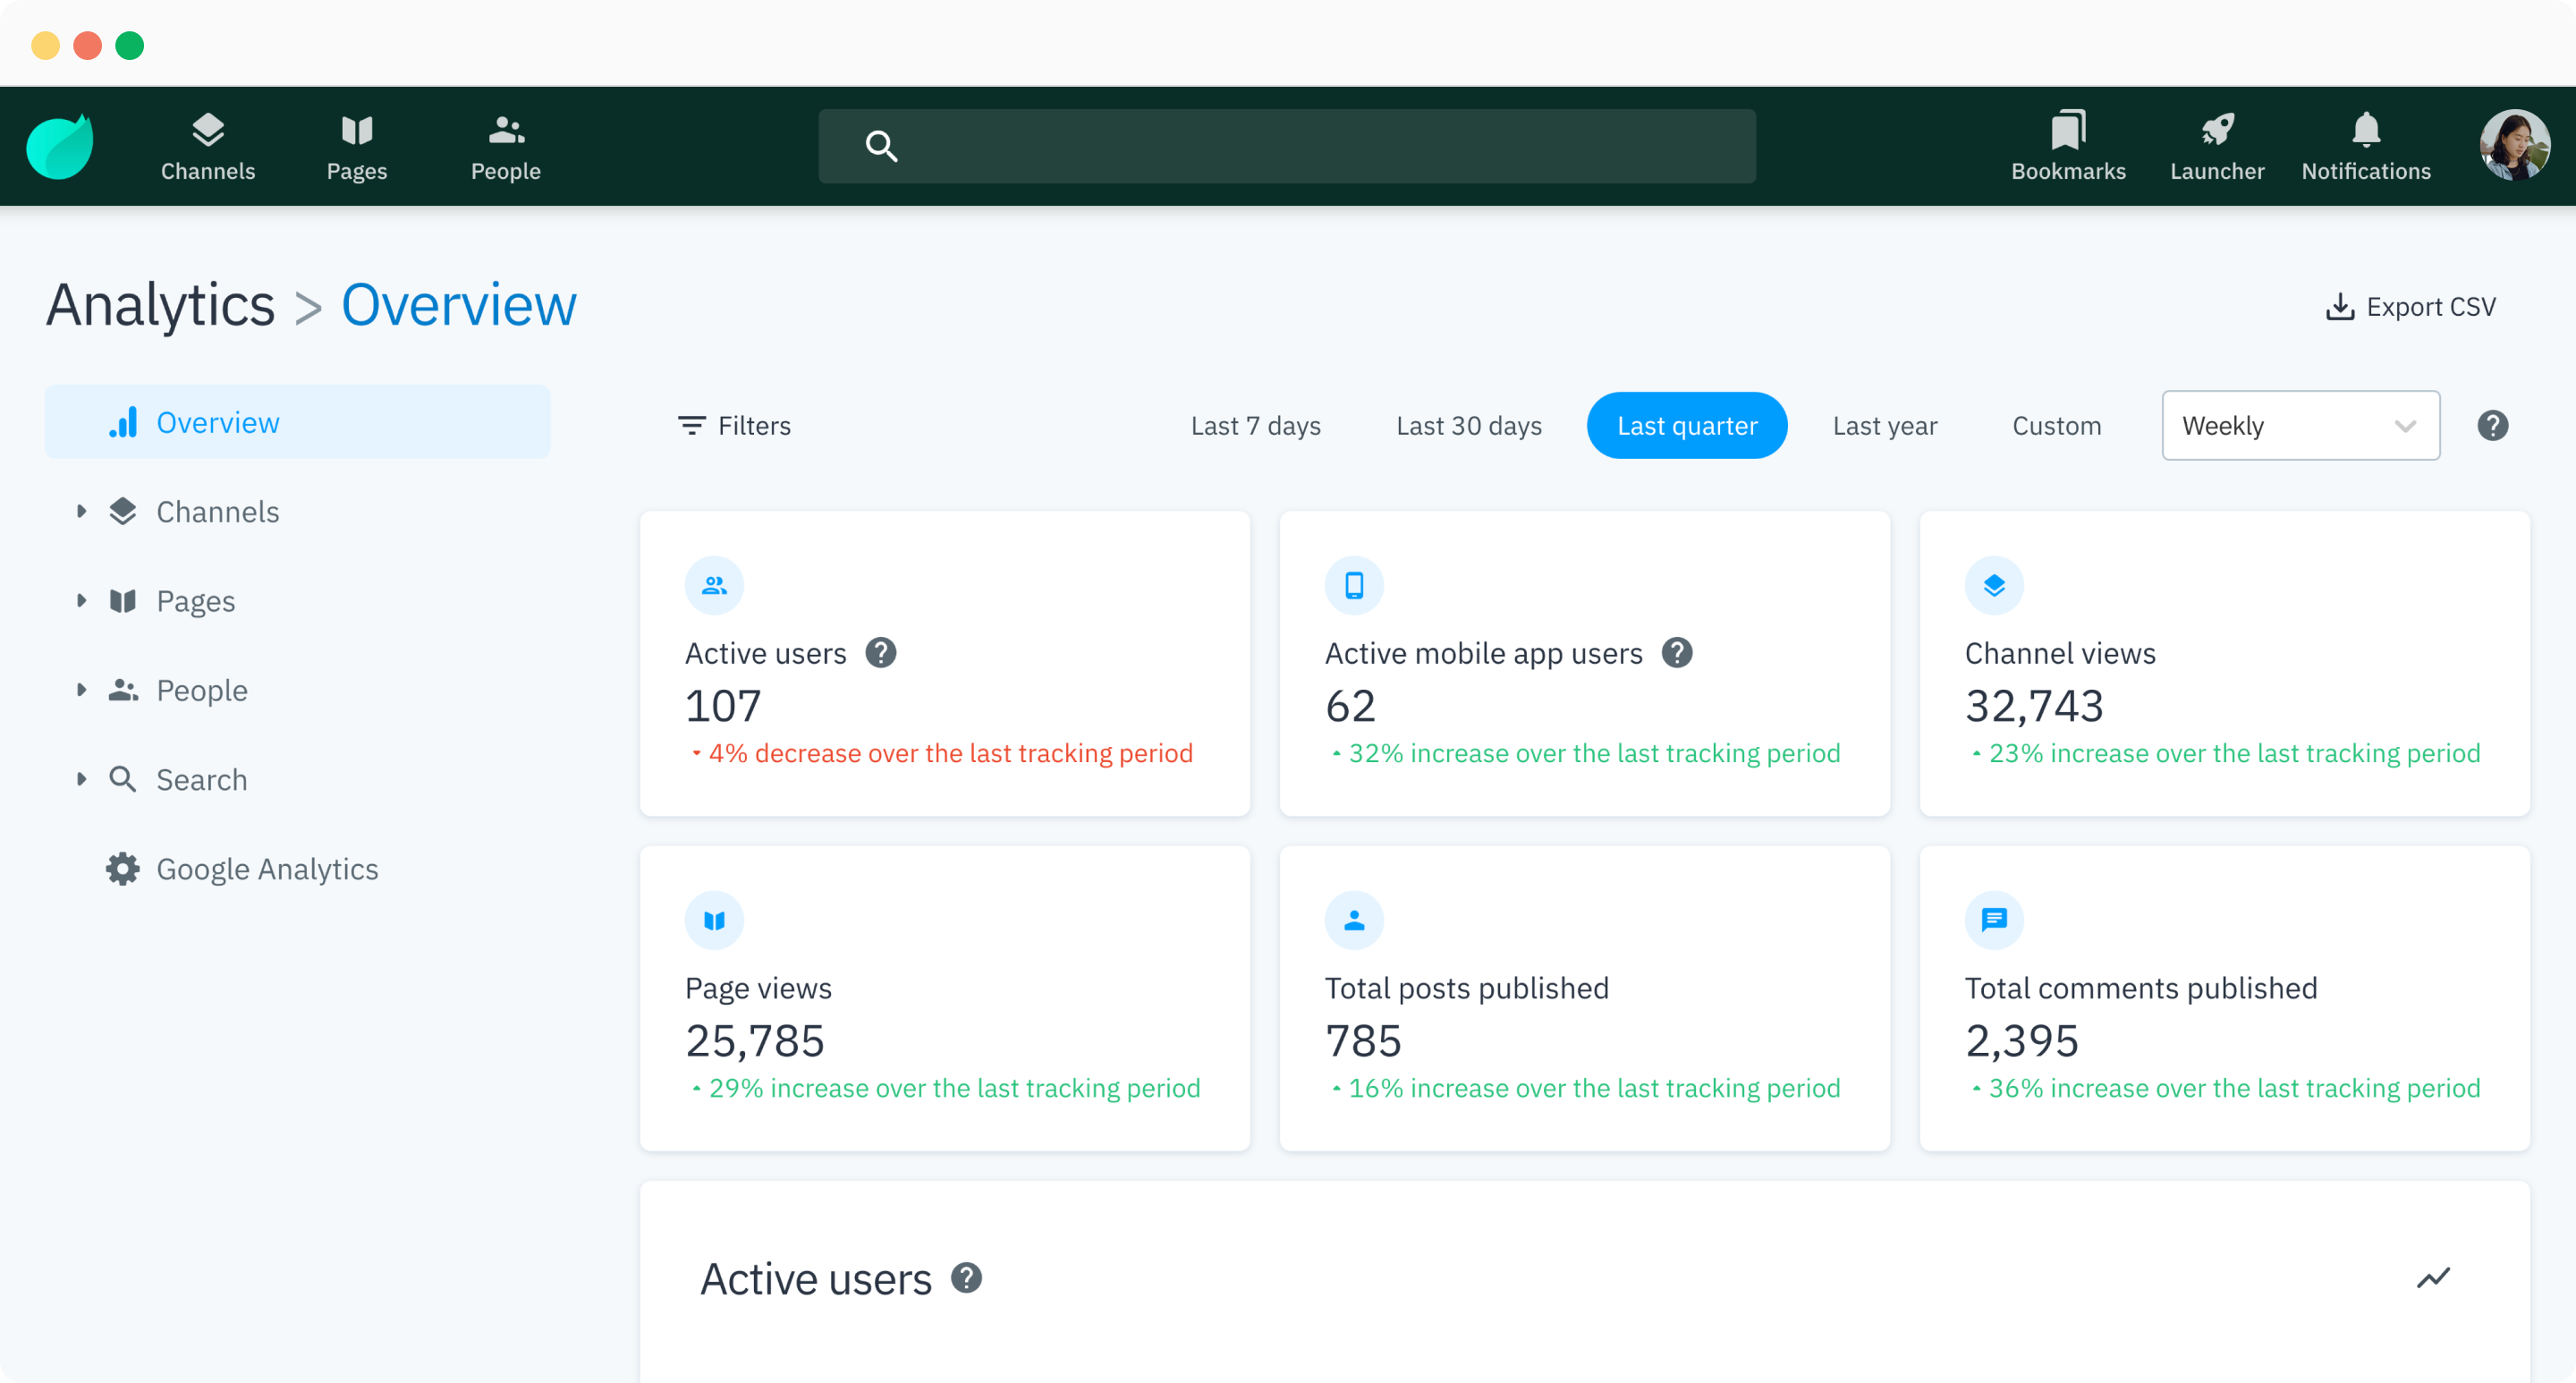
The overview gives you a summary of what has been happening in your Happeo. You can find the most important heartbeat numbers on top such as:
- Active users – Unique users who have started a new session in the selected time period
- Active mobile app users – Unique users who have opened the Happeo mobile app in the selected time period. These statistics are supported by the 1.66 mobile app version and onwards
-
Channel views – The number of views on all Channels within your environment in the selected time period
- A Channel view is counted when a user opens a Channel and when they navigate to a different section. This means that if a user opens a Channel, goes to the Channel Folder, and then to the Channel Calendar, this is counted as three views
- Page views – The number of views on all Pages within your environment in the selected time period
- Total Posts published – The total number of Posts published in the selected time period
- Total comments published – The total number of comments published in the selected time period
You can also find graphs of:
- Active users
- Channel views
- Page views
- Post engagement
To get a more in-depth view of the statistics for each category, you can navigate to a specific section from the menu.
Note: You can view the precise data corresponding to specific days by hovering over the data points in the graphs. Additionally, you can customize the information displayed on the Active Users and Post Engagement graphs by toggling the filtering options at the bottom of the graphs.
Another note: Unique users are counted across the desktop and mobile versions of Happeo. This means that if a user views a Post on both the desktop and mobile versions of Happeo, only one unique view will be counted.
Content filters
Happeo's Advanced Analytics empowers you to uncover deeper insights by filtering data down to the specifics you need. Currently, you can filter by audience and channels, allowing for a more granular understanding of your content's reach and engagement.
Channels
Overview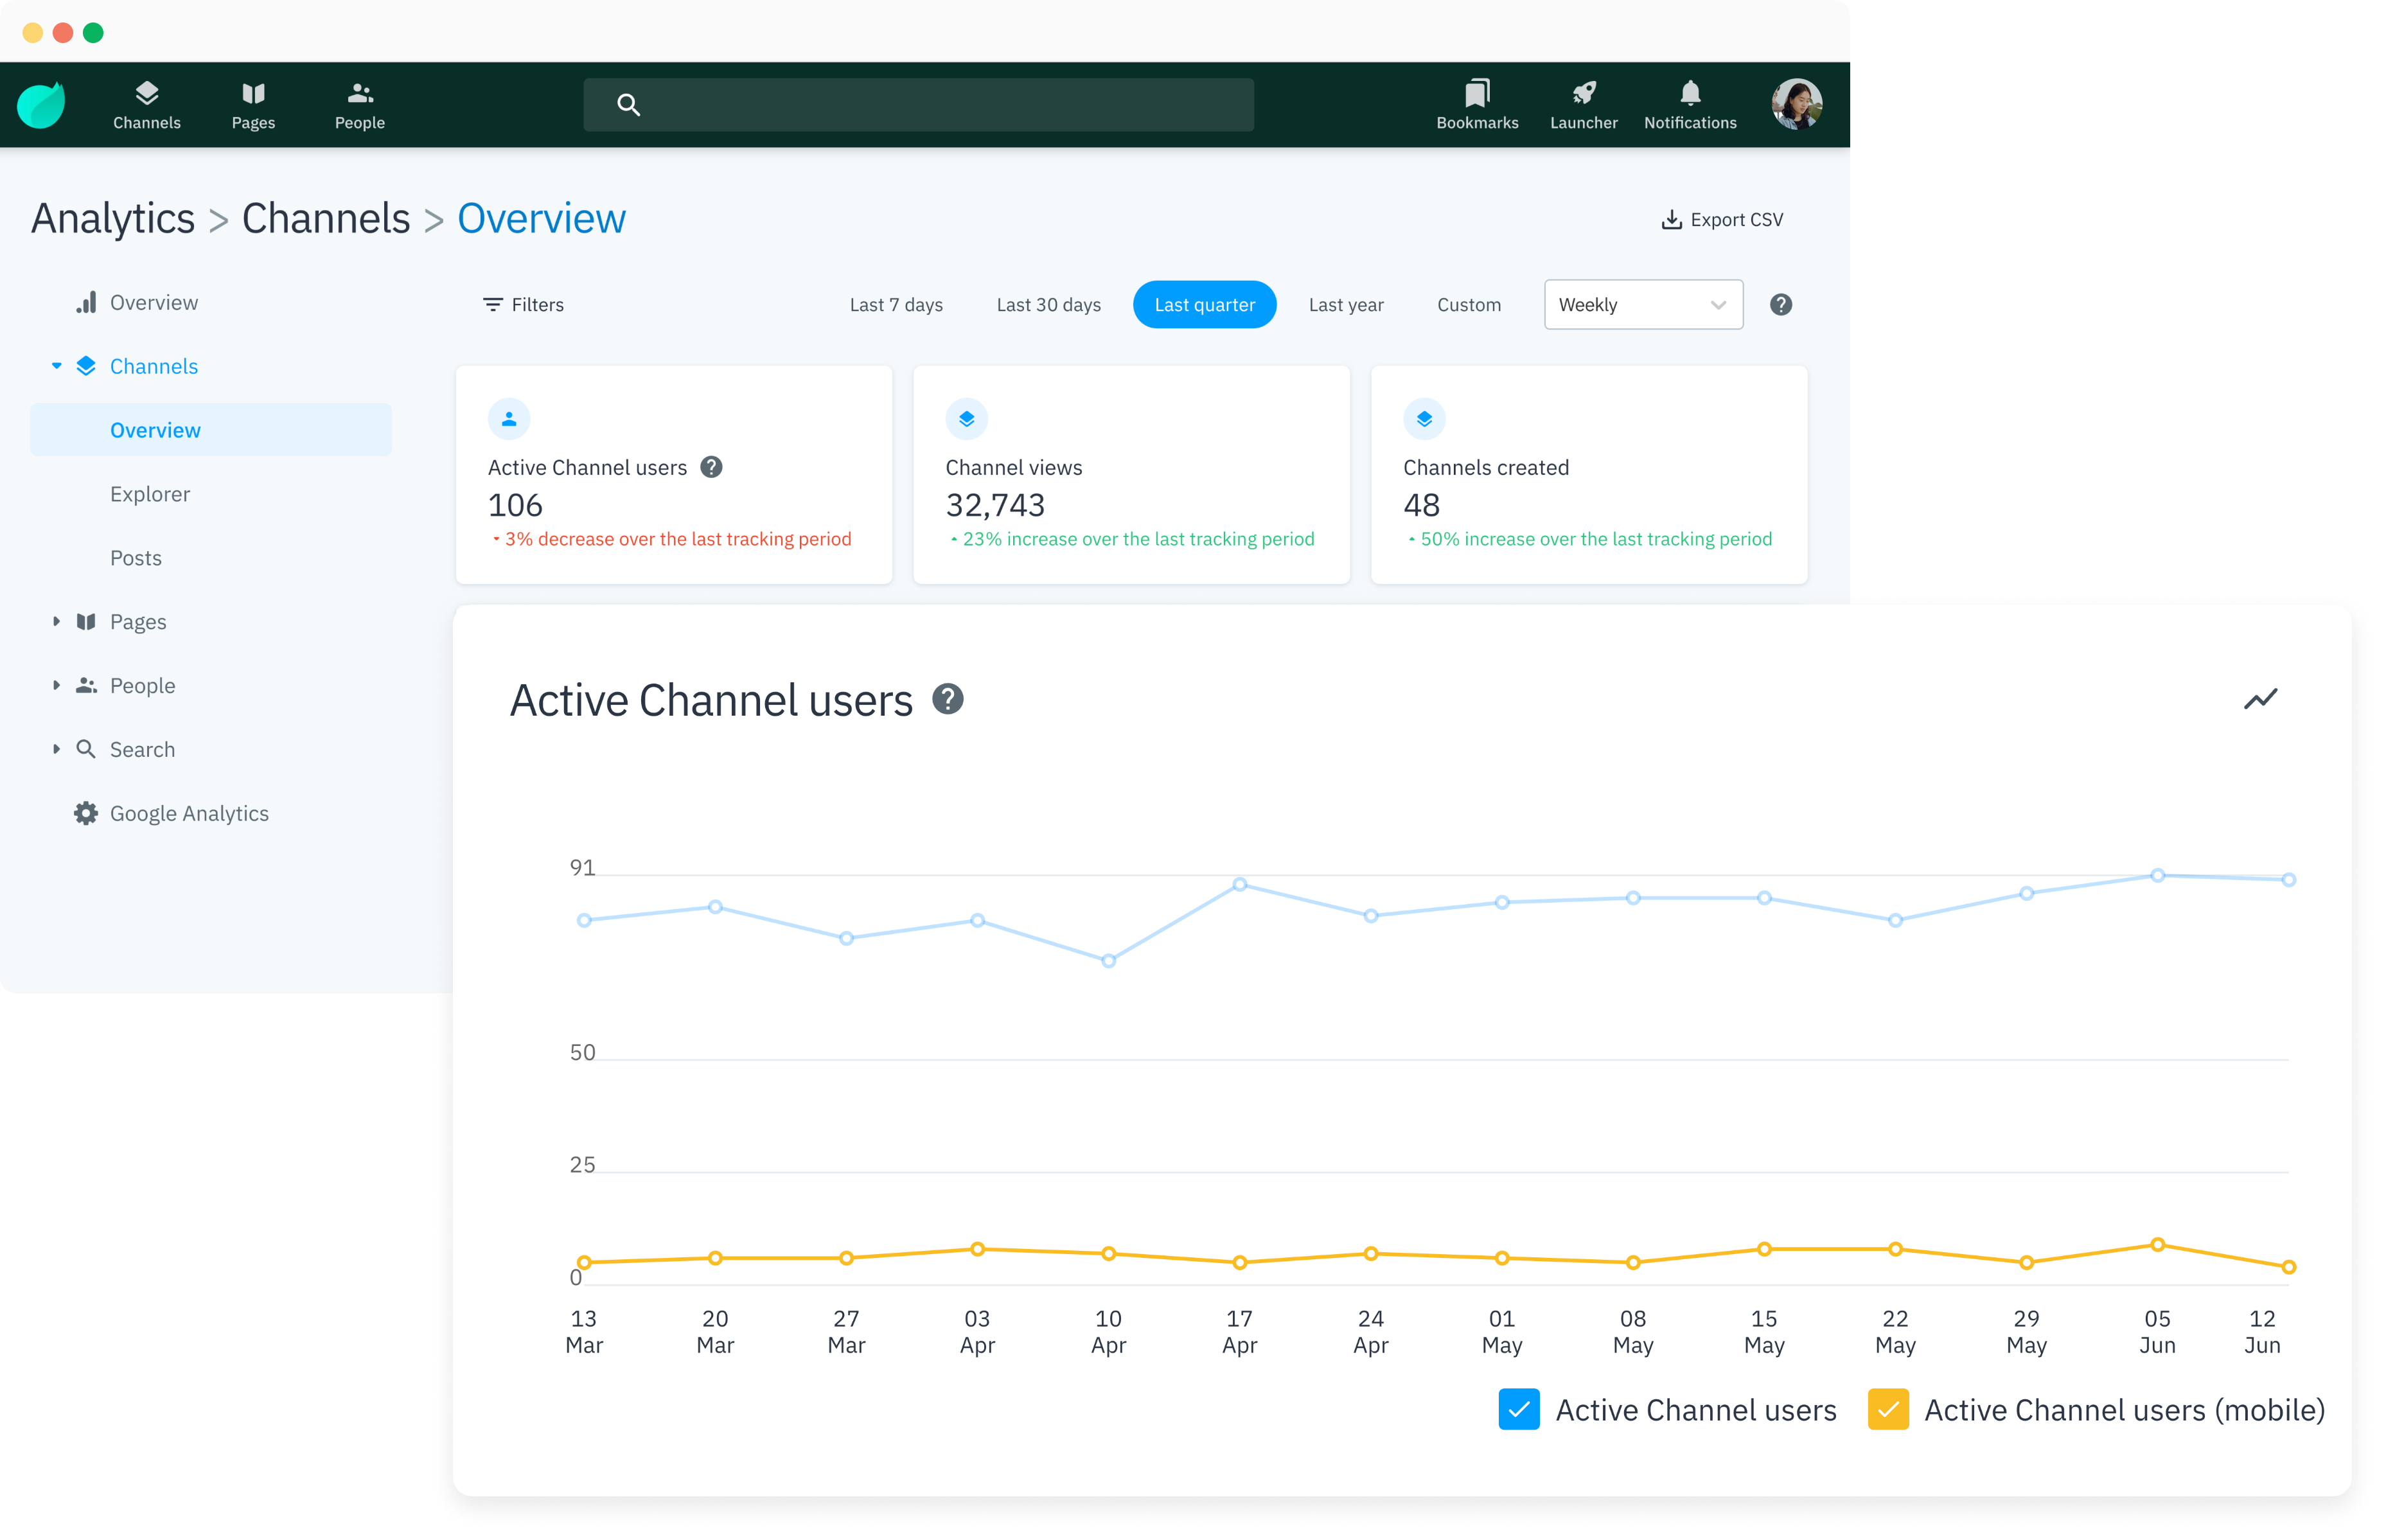
The Channel overview provides you with a summary of how users within your environment are using Channels. You can find the following data:
- Active Channel users – The number of users who have visited Channels in the selected time period
-
Channel views – The number of views on all Channels within your environment in the selected time period
- A Channel view is counted when a user opens a Channel and when they navigate to a different section. This means that if a user opens a Channel, goes to the Channel Folder, and then to the Channel Calendar, this is counted as three views
- Channels created – The number of Channels created in the selected time period
You can also find Channel statistics for:
- Active Channel users
- Channels views
- Channels created
Note: Active mobile app users are calculated the same way as active users.
Explorer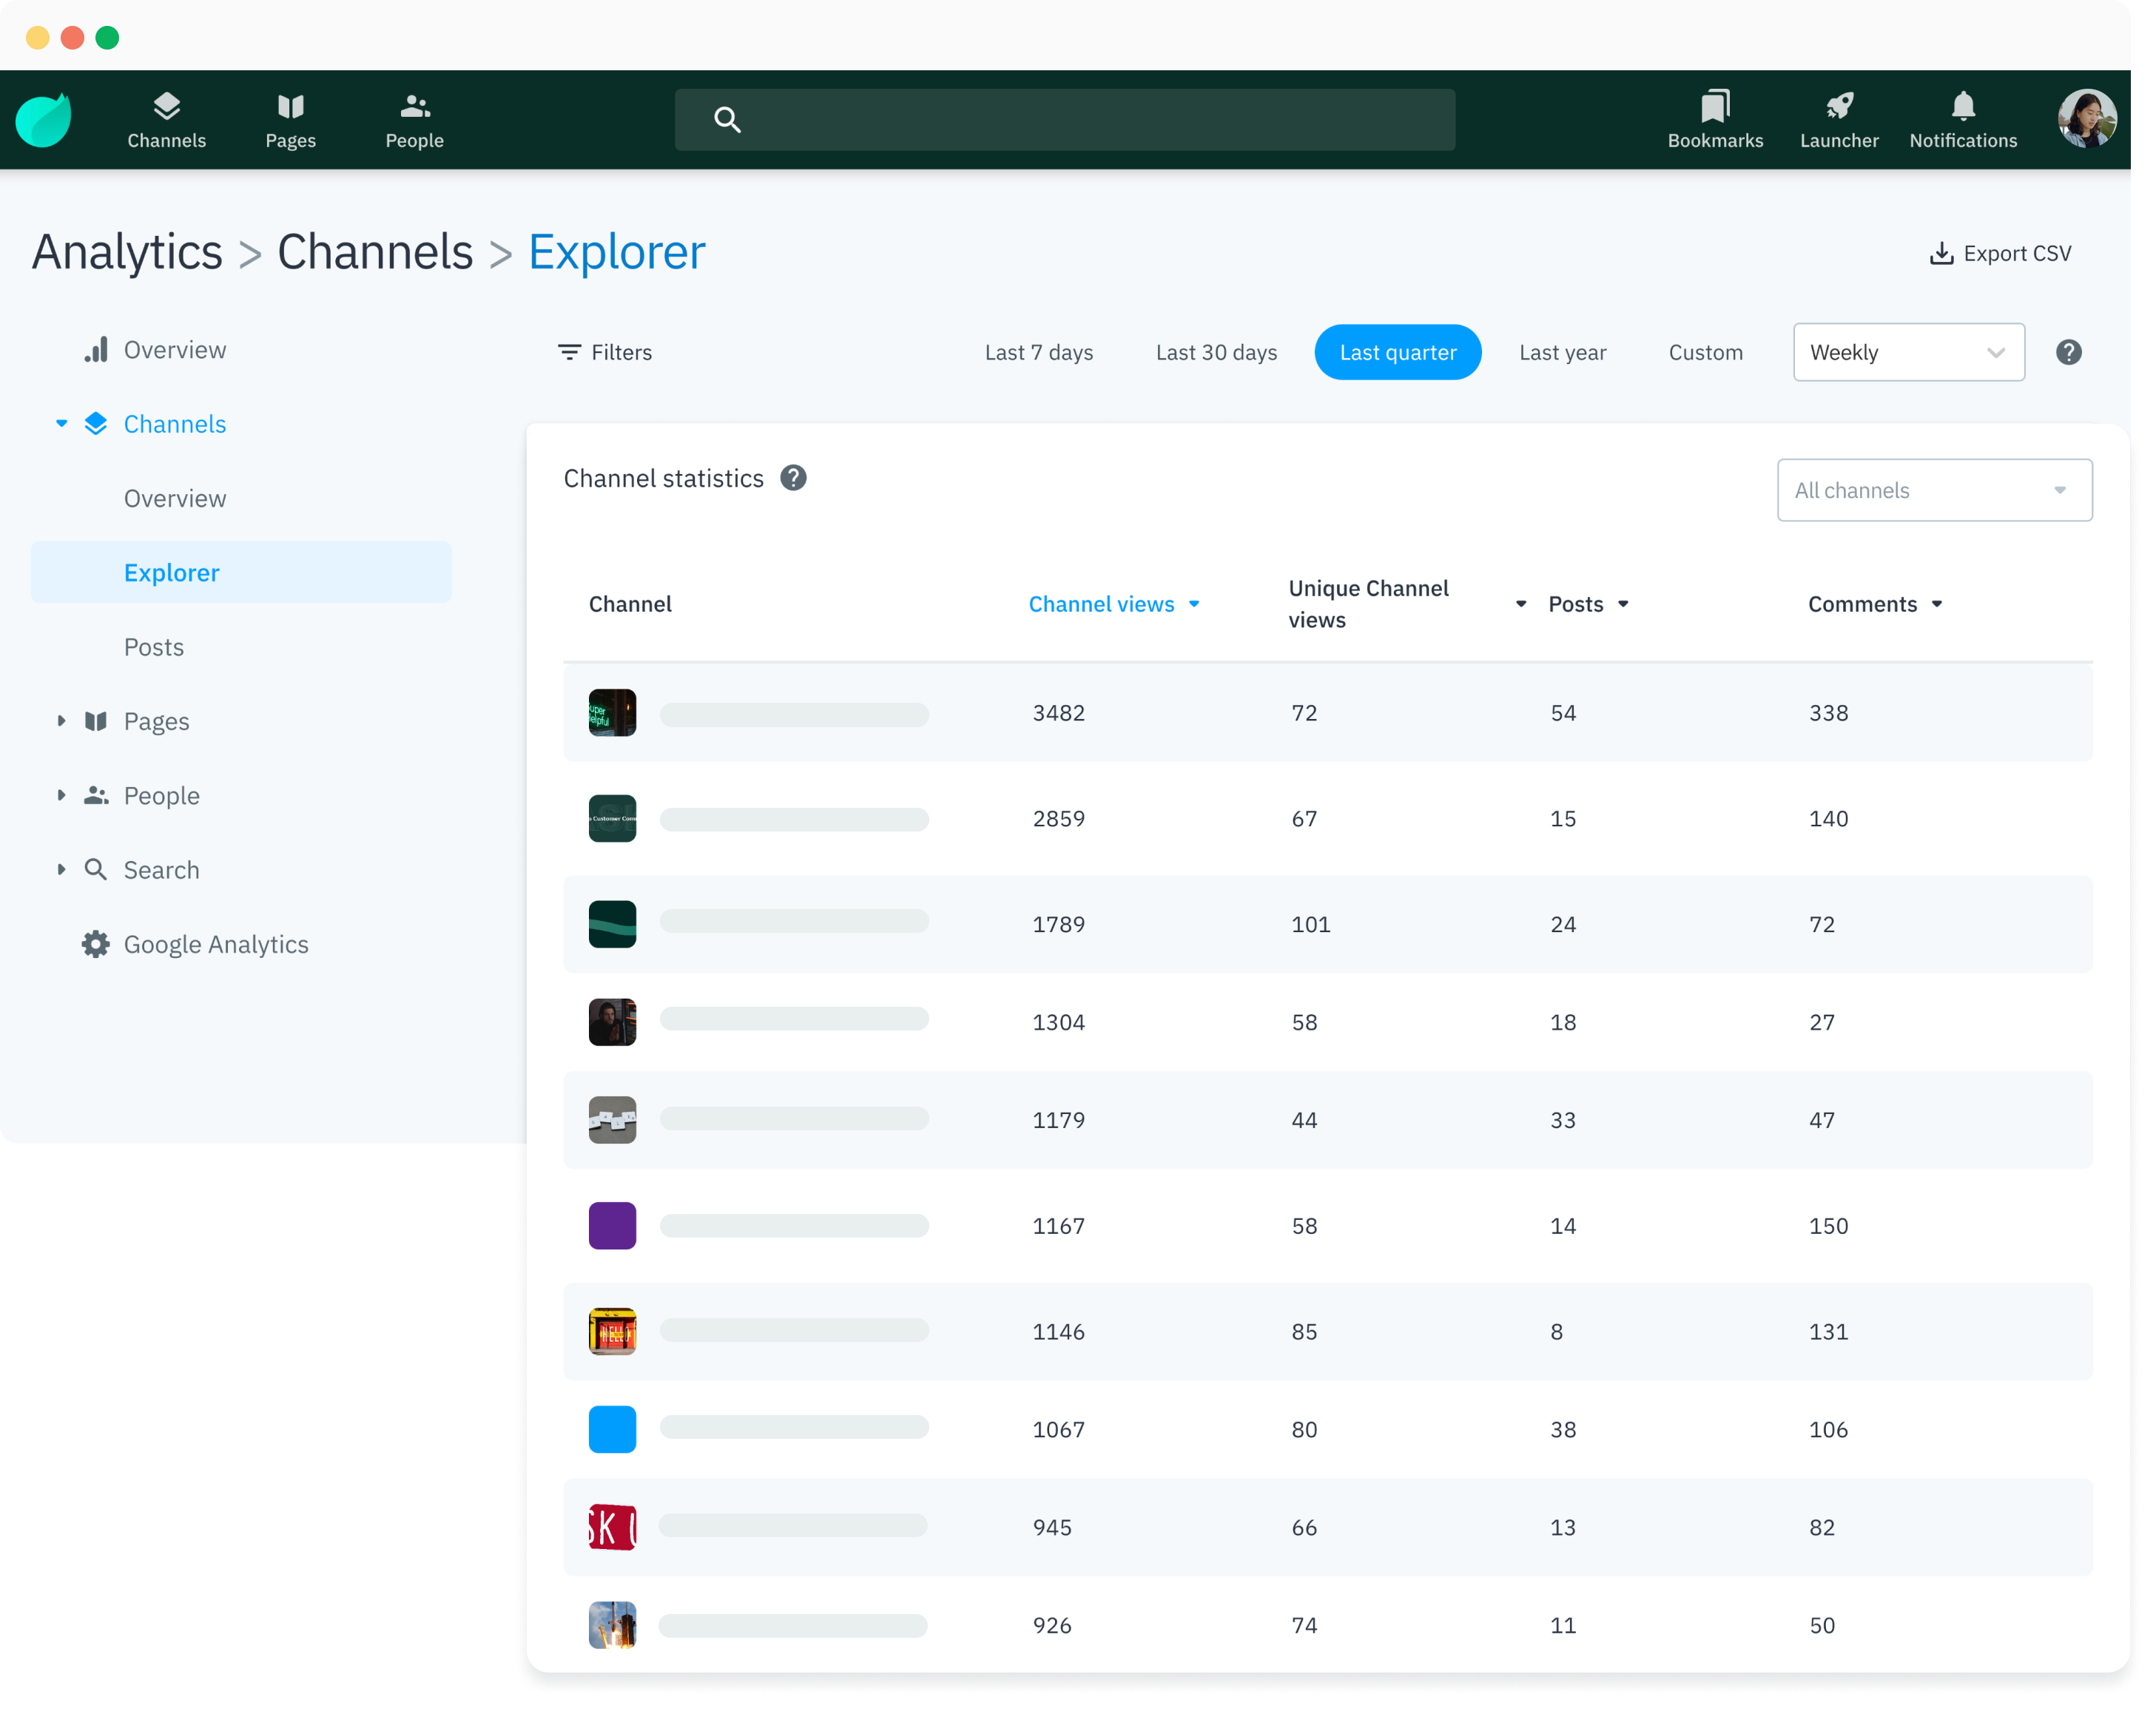
The Channel Explorer presents you with the data for individual Channels. For instance, you can find the following information:
- Channel name
-
Channel views
- The count of every time a user views a Channel in the selected time period
-
Unique Channel views
- The count of individuals who have viewed a Channel in the selected time period
- Posts – The number of Posts published in a Channel in the selected time period
- Comments – The number of Comments made in a Channel in the selected time period
- Drop-down menu to filter between Channels
Posts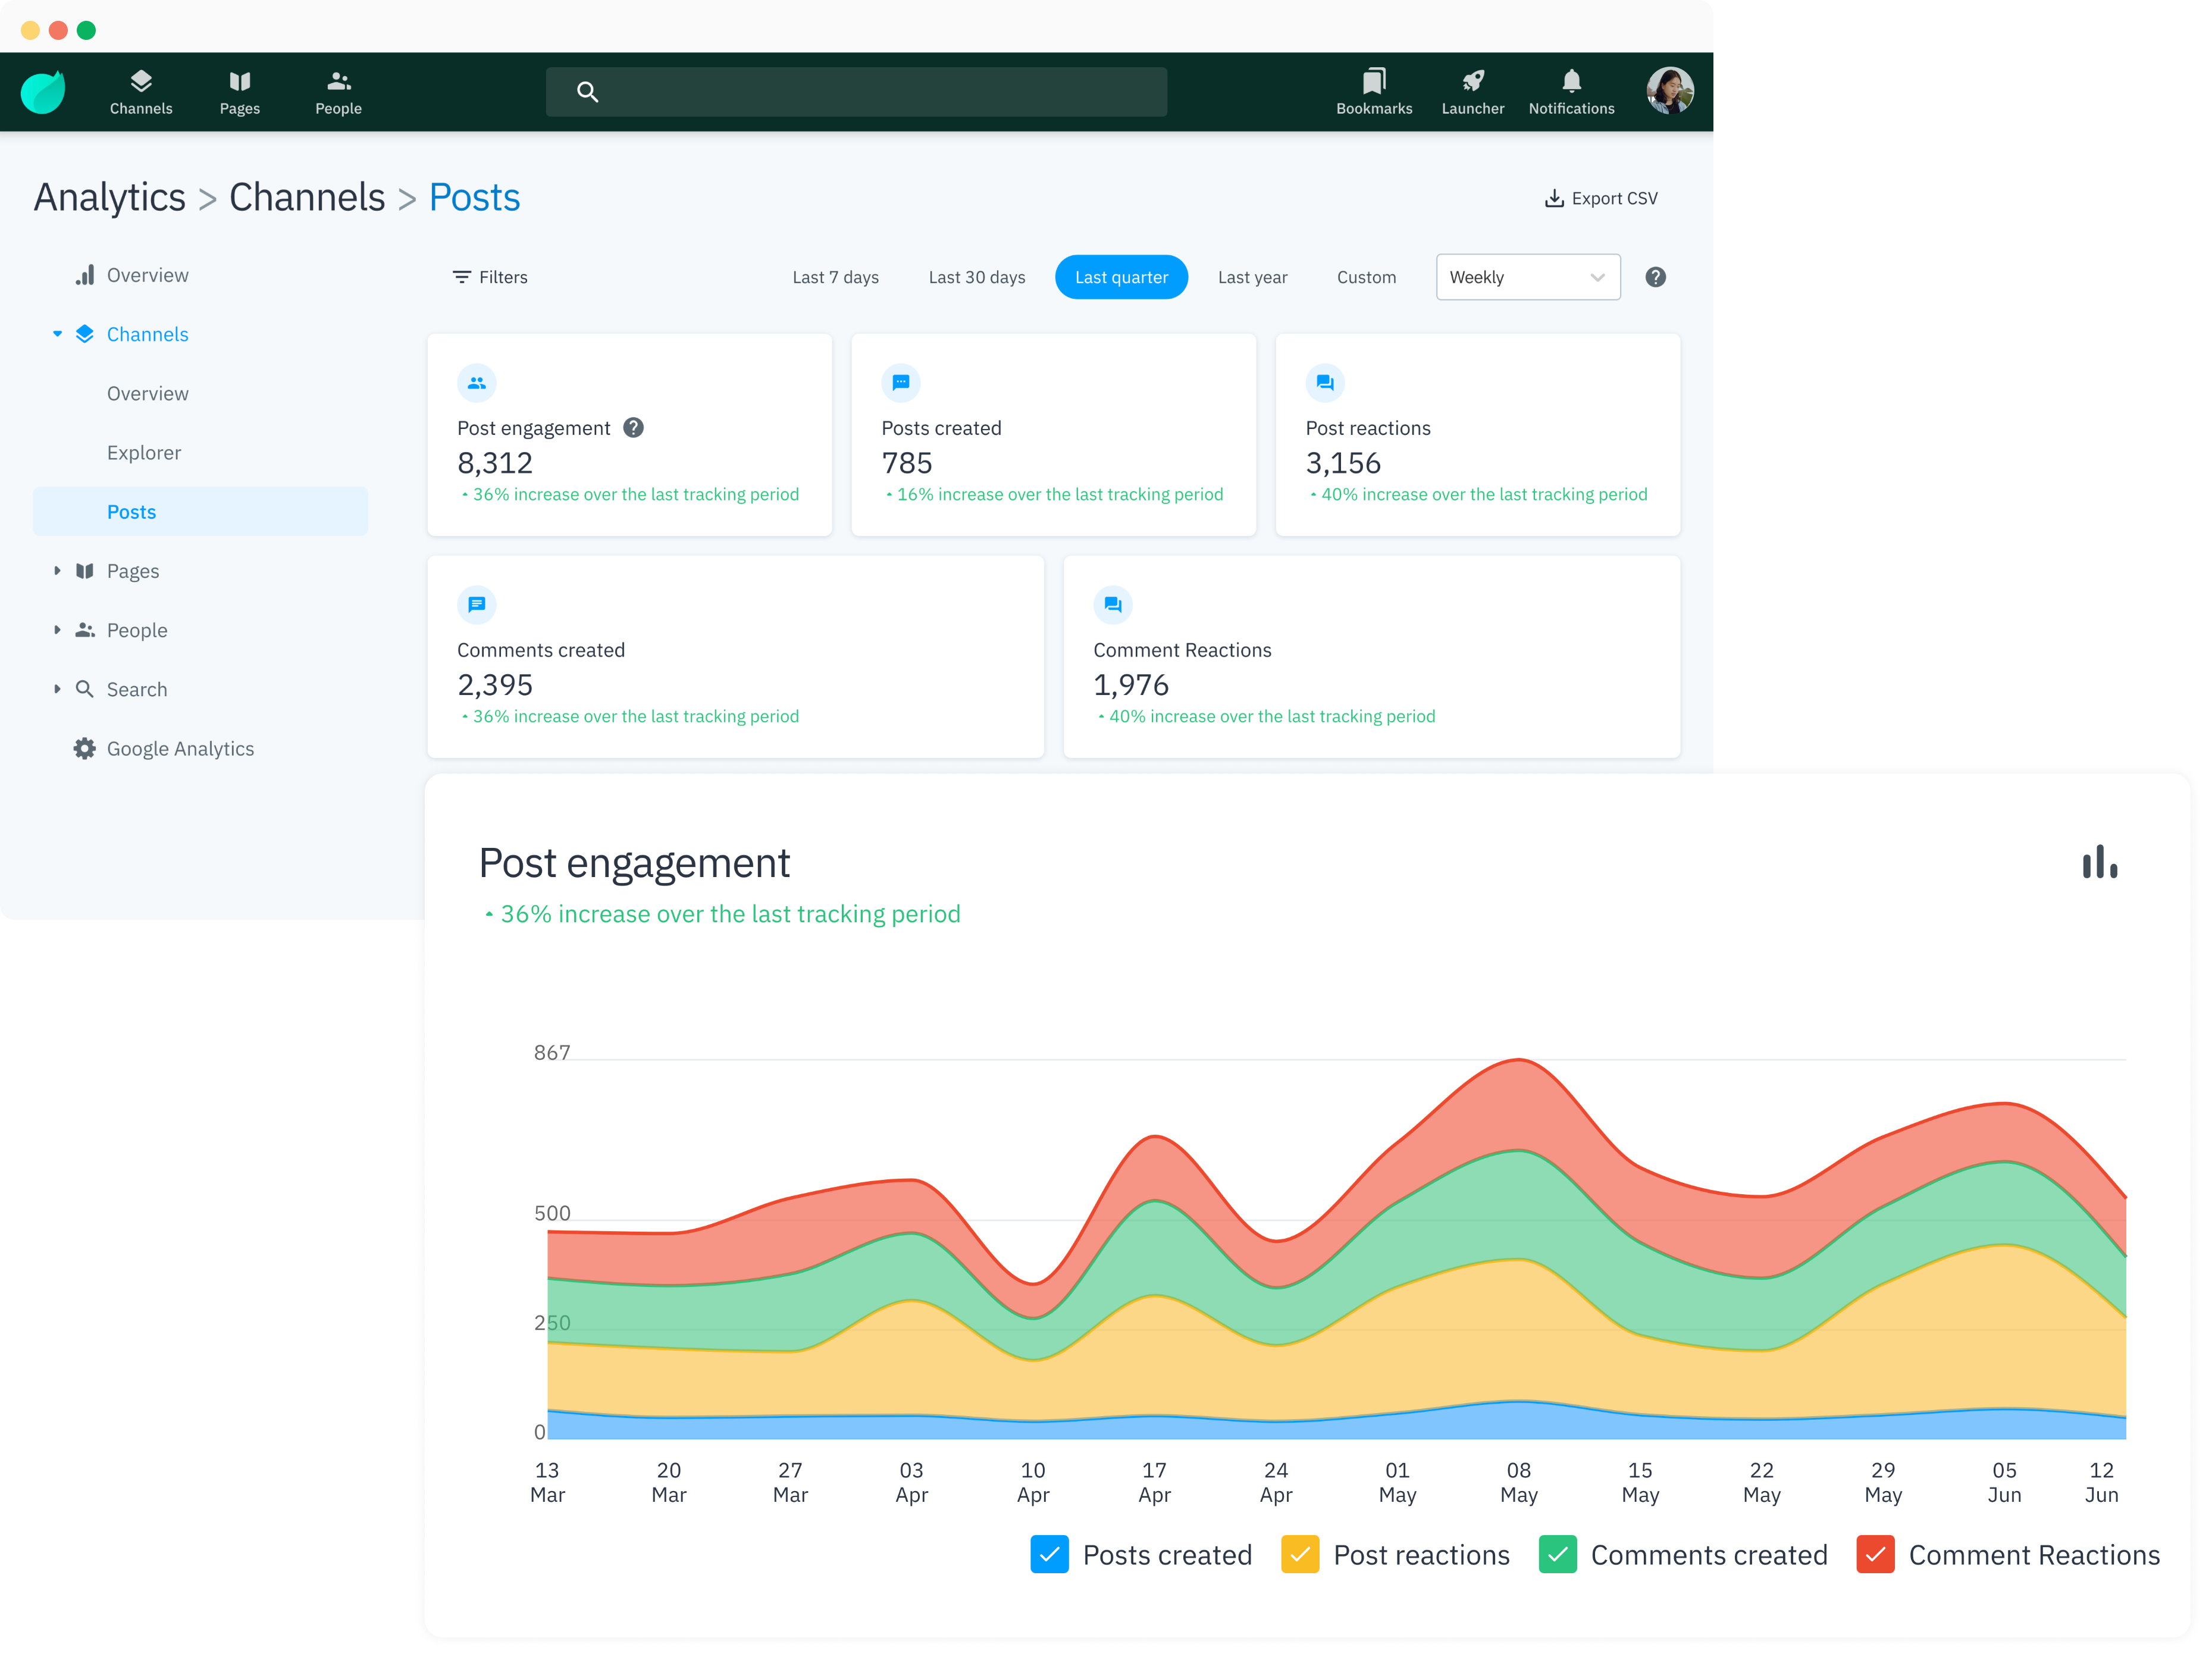
Here, you can find a summary of:
- Post engagement – The sum of all engagement values (Posts created, Post reactions, Comments created, and Comment reactions) in the selected time period
- Posts created – The number of Posts created in the selected time period
- Post reactions – The number of reactions (likes) given to Posts in the selected time period
- Comments created – The number of Comments created in the selected time period
- Comment reactions – The number of Comment reactions (likes) in the selected time period
You can also find a graphical representation of Post Engagement for all Channels within your environment.
You can uncheck the boxes at the bottom of the graph based on the data you want to be shown. The data you can view include totals of:
- Posts created
- Post likes
- Comments created
- Comments liked
By checking these boxes, you will be shown data over a specific period of time depending on your filtering options.
Lastly, by hovering over each data point on the graph, you will be presented with the aforementioned data for a specific date.
Pages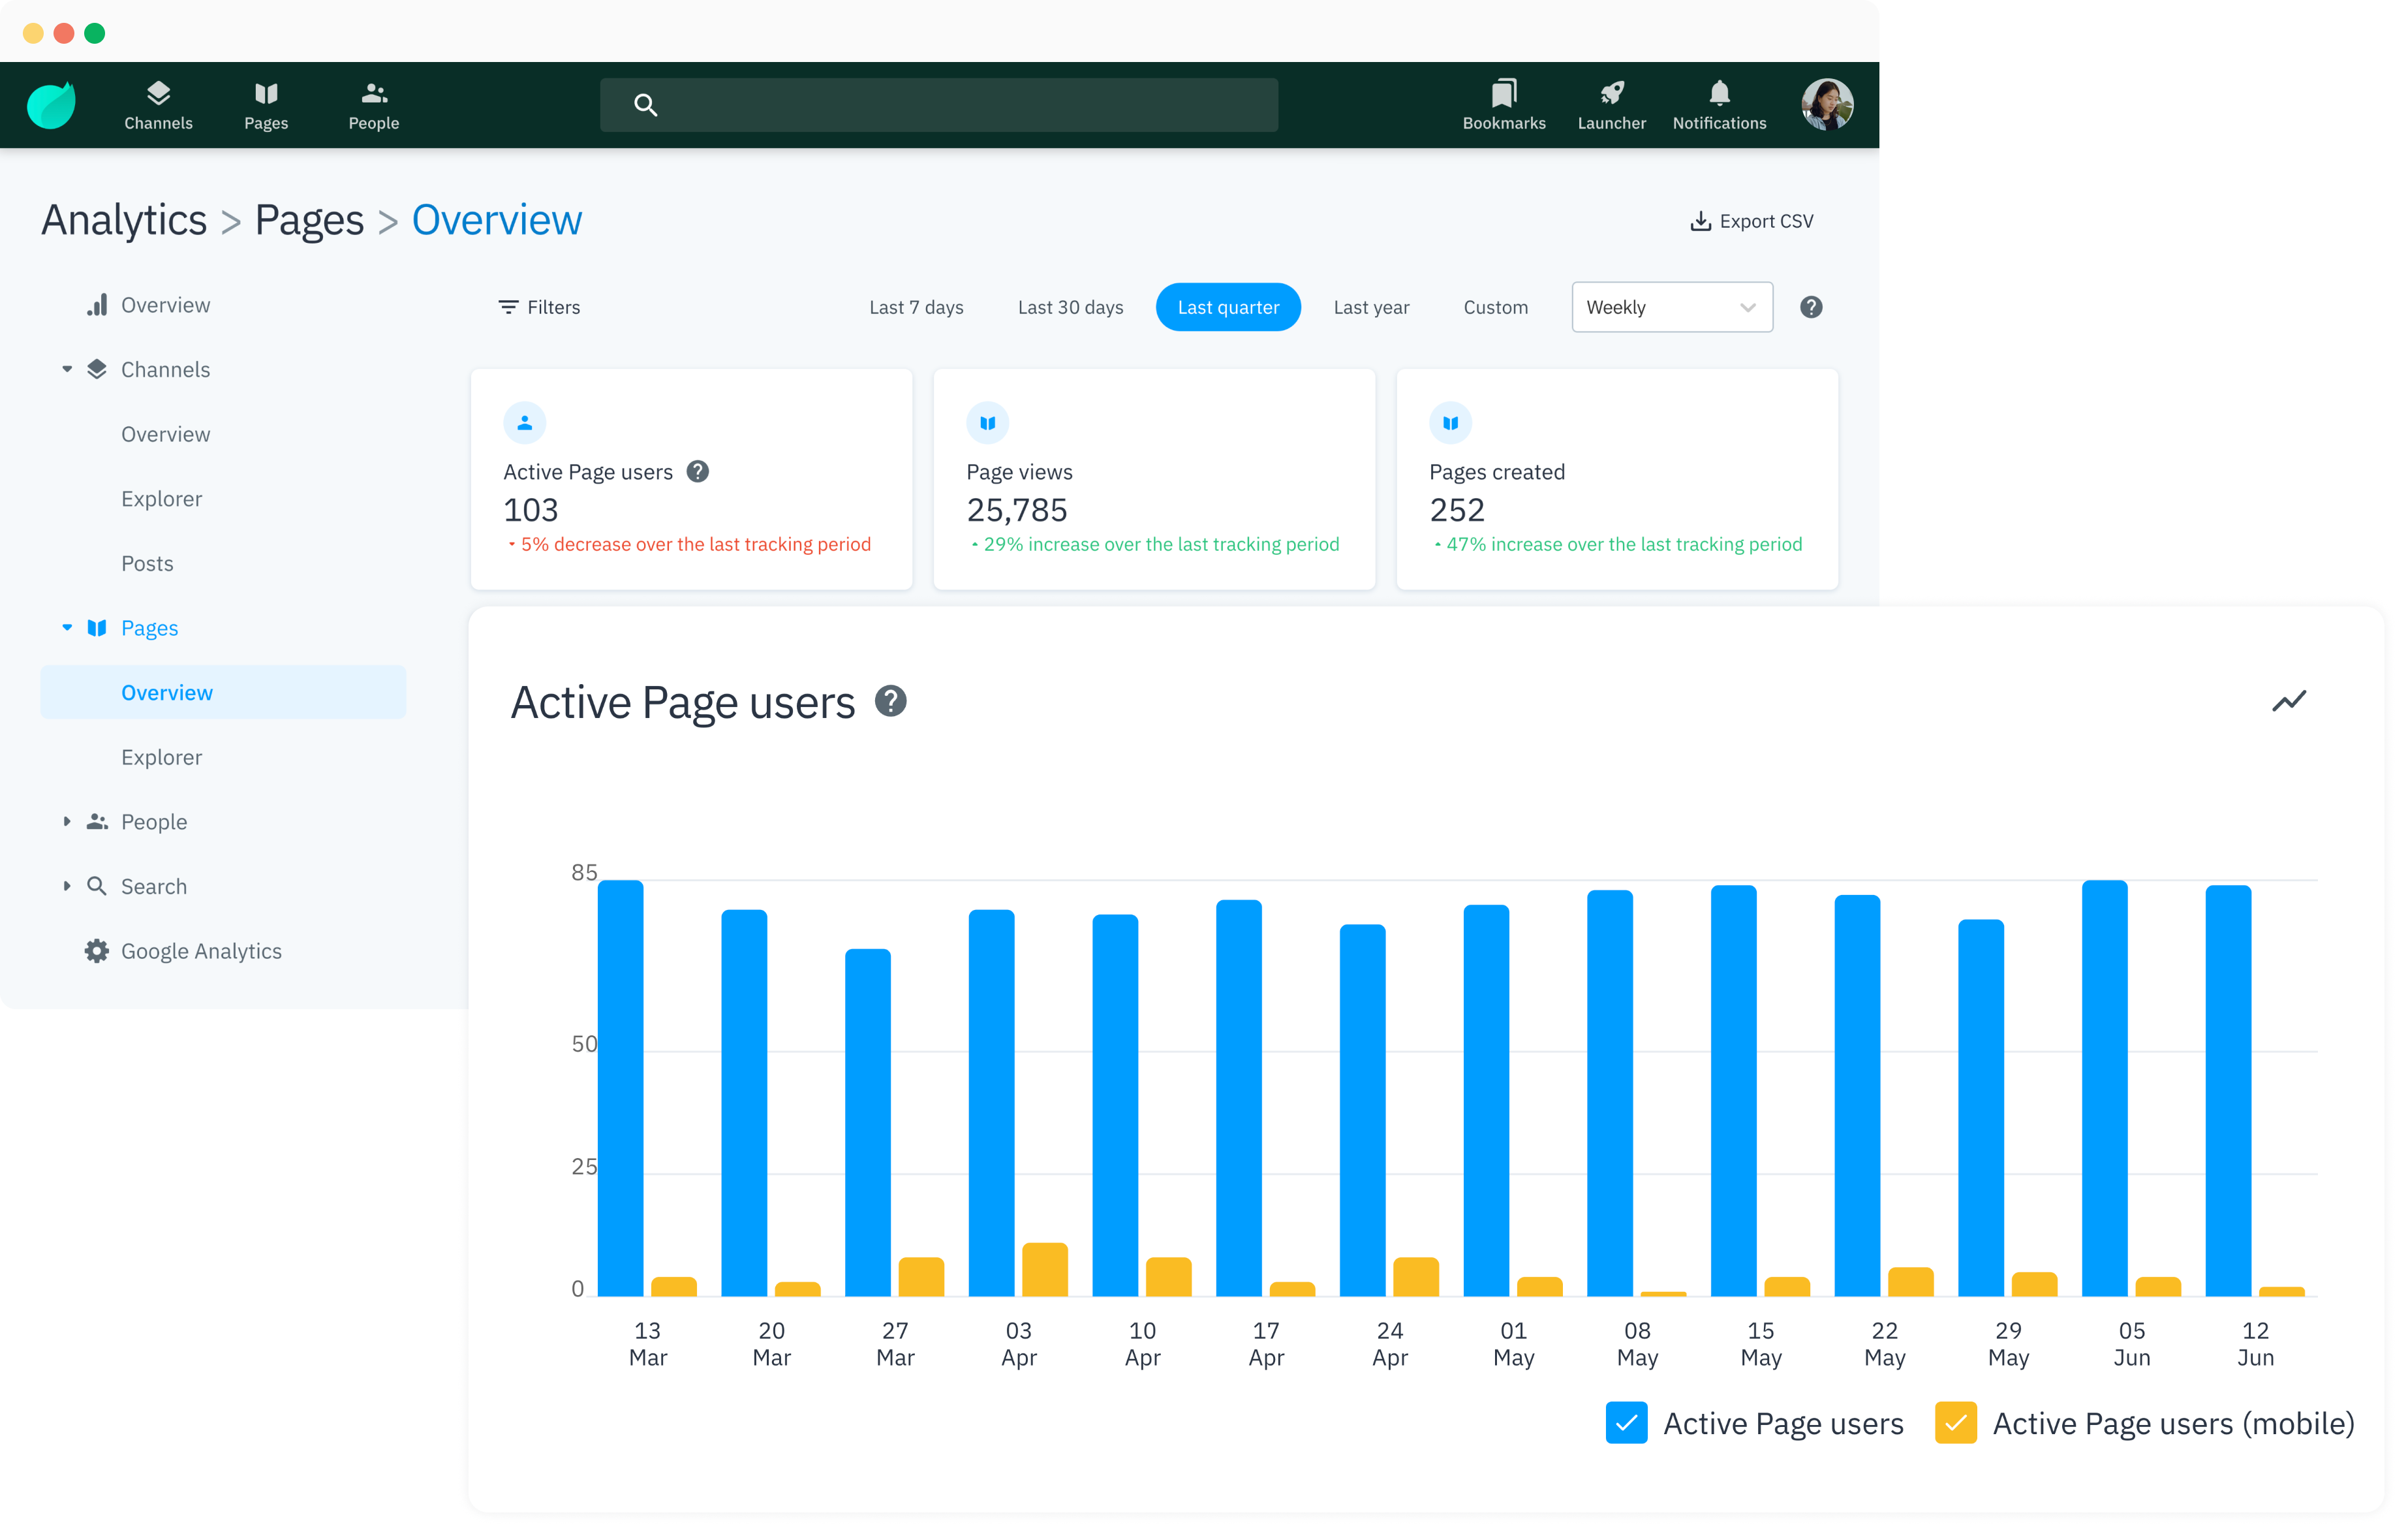
Overview
The Pages overview shows you a summary of the page engagement within your environment. This overview includes data of:
- Active Page users – The number of users who have visited Pages in the selected time period
- Page views – The number of views on all Pages within your environment in the selected time period
- Pages created – The number of Pages that have been created in the selected time period
In the selected time period, you can also find graphical representations of:
- Active Page users
- Page views
- Pages created
By hovering over each data point on the graph, you will be presented with the aforementioned data for a specific date.
You can uncheck the boxes at the bottom of the Active Page users graph based on the data you want to be shown. The data you can view include totals of:
- Active Page users
- Active Page users (mobile)
Explorer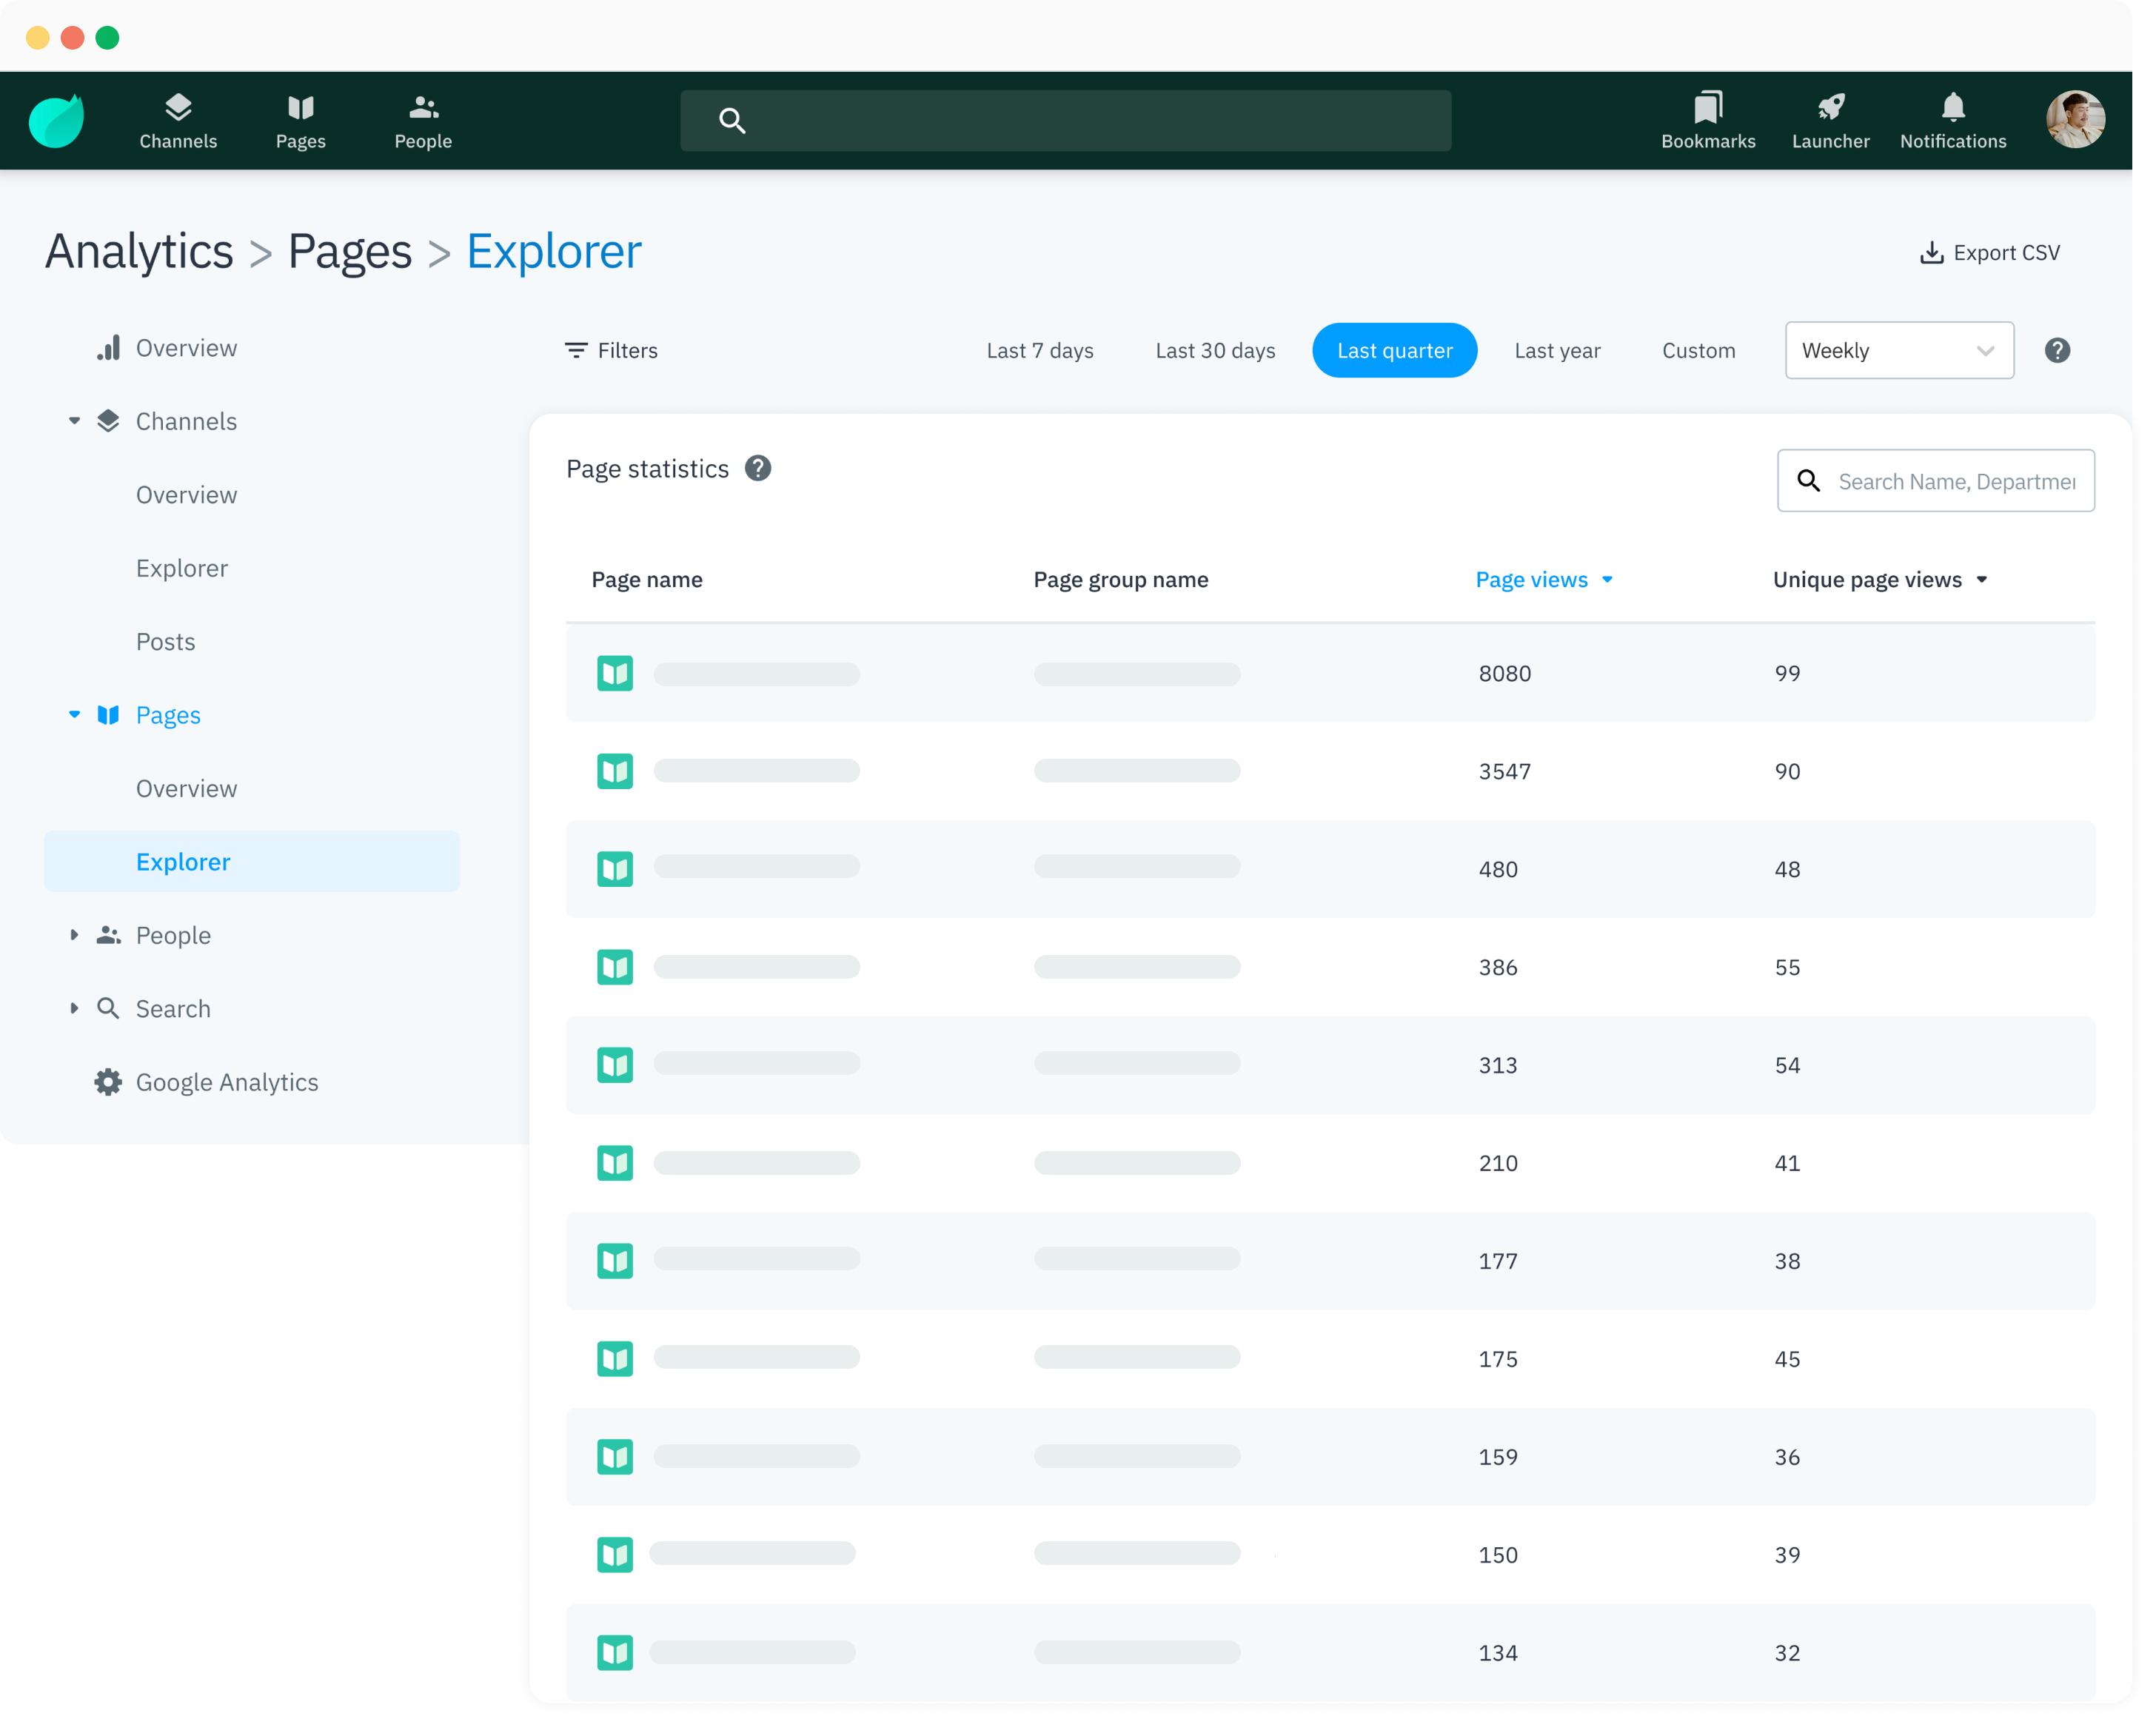
The Page Explorer provides you with data for every individual Page within your environment during the chosen time period. Here, you can find:
- The Page name
- The Page Group name
-
Number of Page views
- The count of every time a user views a Page
-
Number of unique Page views
- The count of individuals who have viewed a Page
-
If a Page is published or unpublished
- By hovering over the question mark icon adjacent to an unpublished Page, you can access additional information about the specific elements that remain unpublished. This includes details such as the unpublished status of the Page's primary language
- Search bar to filter between Pages
People
Activity
The activity overview provides you with a summary of the users who have contributed the most on the basis of the total number of Page and Post impressions they have contributed, as well as Posts and comments they have created. Top influencers have the highest counts in all of these.
Note: Contributors must be active during the selected period to appear on the list. Additionally, the contributors shown are based on the audience you have selected.
In addition, you have the ability to filter the results based on Channels by clicking on the filter option located at the top-right corner of the page.
The data provided in this overview include:
- The contributor names
- The number of Page impressions (views) they have contributed
- The number of Posts they have created
- The number of Post impressions (views) they have contributed
- The number of comments they have created
- The number of reactions they have made on Posts
- The number of comment reactions they have made on comments
- The total of the above
Impressions
Impressions are the total number of unique users who have viewed a Page or a Post.
Note: Pages and Posts can be seen multiple times, meaning they can garner multiple impressions.
Page impressions
Page impressions refer to Page engagement. They are the total number of unique users who have viewed a Page. For a Page impression to appear in the Analytics, a Page must be viewed.
Post impressions
Post impressions refer to Post engagement. They are the total number of unique users who have viewed a Post. For a Post impression to appear in the Analytics, a Post must be seen in full. This does not include or relate to comments and emojis.
Note: For example, if a user views an Article in January and then revisits it in February, it's considered as one unique view since we monitor engagement in the backend. However, if you export data for January and February individually, we'll tally the views for each month, resulting in a count of two views. But if you export data spanning from January to February, it will be treated as a single view.
Why are total impressions not included in Post Analytics?
The reason that total impressions (views) are not included in Post Analytics is due to the way impressions are counted, which takes scrolling into account. When we include total impressions, it can lead to inflated numbers for several reasons. For instance, a Post may remain visible on the Channel for an extended period, which counts as an impression when a user opens the Channel and sees the Post, or the same individuals may read the Post repeatedly. Additionally, a large number of users simply viewing the Post could also contribute to high impression counts.
However, high impression counts may not necessarily provide meaningful insights about the Post's actual performance or engagement. Therefore, total impressions are excluded from Post Analytics because they offer limited value in understanding the Post's true impact.
Post reactions
Post reactions refer to the likes given to a Post.
Comment reactions
Comment reactions refer to replies and likes given to a comment.
Influencer
In the influencer overview, you will be presented with the top influencers for all Channels in your environment within a specified period of time. To filter these Channels, you can click on the Channel filtering option on the top-right of the page and select a specific Channel from there.
The top influencers are determined based on the total number of Post comments, Post likes, and comment likes they have received. Top influencers have the highest counts in all of these.
Note: For influencers to appear on the list, they must have been active during the selected period. Additionally, the influencers shown are based on the audience you have selected.
The data shown includes:
- The influencer names
- The number of Post comments they have received
- The number of Post reactions (likes) they have received
- The number of comment reactions (likes) they have received
- The total of the above
Search
Overview
The Search overview provides you with statistics regarding the total number of searches within a given frame of time. Moreover, it shows you:
- Unique search users - Searches by unique users (if a user performs 2 searches, it is considered as 1 unique search)
- Average time to find results - The average time it takes for users to find a search result
- Average time on opened results - The average time users spend on an opened search result
- Success percentage - The percentage of success when searching for something. Success is determined by clicking on a result after searching
- Failure percentage - The percentage of failure when searching for something. Failure is determined by not clicking on a result after searching
Why do users get domain-based search results? - When the user tab is opened in the navigation, if there is no previous search query, it will search with the user's domain. That will make the domain appear in the search queries.
In the Search overview, you can also find a graph of total searches, which you can filter the data based on:
- Opened item – This means that one of the preview results was clicked
- Gave up – This means that a user opened the search bar, typed in the query, did not click on any results, and left. It can also mean the user did nothing for 2 minutes or longer
By hovering over each data point on the graph, you will be presented with the aforementioned data for a specific date. You can also find the total number of searches for a given date.
Charts vs. cards
In the past, charts grouped sessions by the start time whereas cards grouped sessions by just the general timestamp (without considering start time). This caused a mismatch, especially for monthly views.
Now, cards will also group by the search session start time (just like the charts).
This might lead to slightly different numbers between cards and charts, but it means the data is more accurate overall.
Basically, the data itself hasn't changed, just how it's displayed.
Additional glossary
- Search session – One search session can have multiple queries in it. When a user opens the search bar, a search session is started.
Terms
The search terms presented in this section reflect the most searched terms in your environment within a given period of time. You can also find the:
- Total number of times a term has been searched
- The number of unique search users per term
- Terms’ previous rankings
Note: Search terms are updated in real-time and are constantly changing. However, there can be a delay of approximately 6 hours. This is because the responses are cached for 6 hours at a time. Due to this, we may be showing cached responses that are older than what would be accurate when you view the search terms.
You can also filter the results by:
- Opened item – One of the preview results was clicked
- Refined search – The search query has been modified, but the new query incorporates the previous one. For instance, if the initial query was "Amster," and it is changed to "Amsterdam," it indicates that the user is still searching for the same concept or topic, albeit with a more specific or refined term
- Gave up – The user has not clicked on any results, either in the preview or on the search page. Additionally, they have modified the query in such a manner that the new query no longer includes the previous one
In the All view by clicking on Details next to the search term, you will be given more insight regarding the search term, such as:
- Average search time – The average time it took for users to search a term
- Average result visit time – The average time users viewed a term result
- Average result position – The position of the result (how far up or down in the results the item was shown)
- Clicked result types – The different types of results that were opened when searching with a query
- Results found in sections – Search sections that were used for searches and which showed results to users
What does it mean when a term is trending? – A trending search term refers to a term that experiences a frequent number of searches compared to others during a specific time period.
AI Search Analytics
Package information: AI Search analytics is available to Growth, Enterprise, and Advanced Analytics package users.
What is AI Search?
AI Search is a search function that utilizes AI, either automatically or by user choice. A single session can involve multiple queries, and if AI is used for even one of those queries, the entire session is considered "AI Search enabled."
Unlike non-AI search, which often requires users to click through multiple results, AI Search can often provide direct answers to queries.
This shift in search behavior makes non-AI search analytics, which heavily rely on click data, less effective for understanding AI Search performance. But clicks don't always tell the whole story with AI Search. That’s where AI Search analytics comes in – providing a more tailored approach to measuring user interactions and the effectiveness of AI-powered search.
Where to find AI Search analytics
To view AI Search analytics:
- Click on your avatar
- Navigate to Analytics > Search > AI Overview
Key metrics:
- Total AI searches – The total number of searches performed using Search AI
- No answer percentage – The percentage of AI Search queries that did not yield a result
-
Positive feedback – The percentage of positive feedback on AI Search results (based on "thumbs up" clicks)
- Calculation – % of positive feedback = (thumbs up / total) * 100
- Details – Clicking "View details" shows specific queries with positive feedback. For more information about feedback, please see the section titled “AI feedback” below
-
AI vs Non-AI search usage – A comparison of the usage of AI Search versus non-AI search
- You can change the way data is presented in the graph by clicking the line graph icon at the top right
- You can also toggle “Search sessions with AI” and / or “Search sessions without AI” from the graph view
AI feedback
User feedback
Site owners and admins can analyze positive (thumbs up) and negative (thumbs down) user feedback on AI search results. This feedback includes both qualitative comments and quantitative data.
The table shows:
- Search Query – The wording of the search submitted for an AI response
- Date – When the query was submitted
- Feedback – Whether the response was given a thumbs up or thumbs down
- Description – The user's categorization of the AI result (e.g., 'correct answer,' 'easy to understand')
- Written feedback – The user's explanation for their rating (good or bad)
This additional context empowers site owners and admins to understand the reasons behind user feedback, helping them to identify and address any issues or gaps in their content.
AI Search Feedback data export
To see a detailed overview of AI Search feedback data, click 'Export CSV' at the top of the Analytics page and select 'AI Search feedback data.' For more information about how to read the data, please see this article.
How Search Analytics are calculated
How they were calculated in the past
Our Search Analytics categorized user searches into three main groups: successful, failed, and refined. These categories accounted for 100% of all user interactions with our search system.
However, upon the release of the new search experience, how we defined failed and refined searches led to:
- Refined searches being classified as failed
- And successful searches as refined
This is why you might have seen your search success percentage decrease. In reality, some of those searches that were initially labeled as failed were actually successful when you consider the refined searches that followed.
For example:
- Changing “Produkt” to “Product” would be a failed search. This should have been a refined search
- Changing “Product” to “Product Roadmap” would count as a refined search
- If you start typing "Pro," see some results, get distracted for 5 seconds, and then continue by adding "duct" to form "product" and click on a result, it would be counted as two separate searches. One is a refined search, and the other is a successful search session rather than just one successful search
How they are calculated now
- Success and failure together make up 100% of total searches. Refined searches are calculated separately
-
The concept of a refined and gave up query was redefined according to the current behavior
- Refined – This means that a user started a query and then changed that query. If you change the query to a different word completely, it won’t count as a refined search
- Gave up – This means that a user opened the search bar, typed in the query, did not click on any results, and left. It can also mean the user did nothing for 2 minutes or longer
- The Overview section in search analytics is based on Search Sessions
-
Terms are based on Search Queries
- This means the average time to search increases, in some cases rather dramatically. However, this adjustment leads to greater accuracy, as a search session encompasses all the queries a user employed to reach their final result
Google Analytics
This section will enable you to use a Google Analytics tracking ID to use Google Analytics to track how Happeo is used. To learn how to set up this integration, please see our article regarding the Google Analytics integration.
Exporting a CSV
From the Analytics page, you can export a CSV of:
- General overview
- Unique users
- Channel statistics (including hashtags)
- Page statistics (including hashtags)
- Top searches
- Raw search data
- Individual Post Analytics
- Time series Post Analytics
- AI Search Feedback data
- User engagement statistics
- User influence statistics
On the Analytics page, you can first adjust the time frame of the data (e.g. 30 days). This will present the data in the CSV file based on the time frame you have set.
Note: The earliest day for a custom time frame is 2 years into the past.
To export a CSV of any of the above data, you can find the export button at the top right corner of the page. By clicking on any of the types of data, a CSV file will automatically be downloaded.
Q&A
If Happeo is set to open by default when opening a browser, does it affect the count of "Active Users"?
Yes, when Happeo is reloaded by a user, it will affect the "Active Users" count.
An Active User counts as any user who has visited any part of Happeo, including when Happeo is launched as a homepage in a browser.
Note: When your Happeo homepage is opened by default as your browser's homepage, it will count as a Page view.
When counting Page views, does going from the environment's homepage to another, and then back to the homepage count as three different Page views?
Yes, the aforementioned scenario will be counted as three Page views. However, in this case, there are two unique page views:
- One for the homepage
- And one for Page you visited
Is it possible to get a full list of Pages (not Page Groups) in the CSV export?
Unfortunately, obtaining a complete list of Pages in the CSV export is not currently possible. However, you can use a workaround by adjusting the start date in the Analytics view settings. By setting the start date to date as far back as two years, you can include as many Pages as possible in the export, thus creating a more comprehensive list. While this method may not capture all Pages, it can help provide a broader overview of the available Pages in the exported CSV file.
Is there a way to see who isn't using Happeo?
To determine who isn't using Happeo, you can utilize the CSV export feature accessible through Admin Settings > User Management.
By exporting the CSV file, you will gain access to various user data, including a "Last Seen" column. If a user's last seen status is marked as "Unknown," it indicates that they haven't utilized Happeo at all, implying that they are not actively using the platform. By reviewing this column, you can identify users who haven't been active on Happeo and conclude that they are not currently using the platform.
To learn more about how to export a user list CSV, please see this article.
When is something considered a “refined search?”
The classification of a search term as “refined search” occurs when a user modifies their initial query in the search bar, and this modification is detected within a debounce time of 0.3 seconds. During a 0.3-second interval, if the new query differs from what the user had typed 0.3 seconds ago, the system takes two actions:
- It performs a new search based on the modified query and returns relevant results
- It triggers the recording of a corresponding analytics event, which could be classified either as a “refined search” or as the user “giving up,” depending on the nature of the changes made to the query
In essence, the user modifies the term in the search bar, and the system responds accordingly based on the timing and nature of the modification.